


Stratos LV/LV-T Technical Manual 57
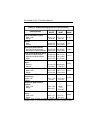
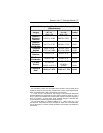
Table 15: Composite of Six Minute Walk Test and QOL
(Effectiveness)
Category
Study Group
(N = 74)
Mean ± SE
Control Group
(N = 38)
Mean ± SE
P-value
*
Distance
Walked at
Baseline
310.51 ± 10.89 288.76 ± 15.37 0.249
Distance
Walked at
Six-Months
340.77 ± 12.32 301.84 ± 17.02 0.067
∆ Distance
Walked
30.26 ± 10.40
17.27% ± 5.59%
13.08 ± 13.05
8.71% ± 5.26%
0.322
0.326
QOL Score at
Baseline
44.39 ± 2.78 45.53 ± 4.13 0.817
QOL Score at
Six-Months
28.68 ± 2.66 33.95 ± 4.35 0.279
∆ in QOL
Score†
15.72± 2.83
19.08% ± 12.21%
11.58 ± 3.45
-13.42% ±
34.54%
0.376
0.281
Composite
Rate
‡
18.18% ± 7.07% -2.36% ± 17.73% 0.030
*
The calculated p-values are associated with a Student's t-test (2-sided) of the
equality of means in the two groups, except for the p-value of the composite rate,
which is associated with a test of equivalence (non-inferiority).
†
∆ in QOL Score is calculated as the average of the individual differences
between Baseline and Six-Months for each patient. Negative values for mean ∆
QOL in percent are possible when positive mean values for absolute changes in
QOL are recorded. In some cases, small, negative changes in absolute QOL
scores resulted in relatively large percentage changes.
‡
The Composite Rate (=(∆ Distance Walked (%) + ∆ QOL Score (%)) / 2) is
calculated for each patient and then averaged to obtain the Composite Rates.
For all calculations, a positive number represents improvement from Baseline to
Six-Months.