


37
12.2.1 Toolbars
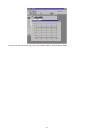
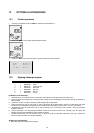
Additional tool bars menu appear when the data view window or the graph view window is selected.
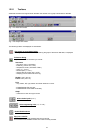
Fig. 11.2a: Data view toolbar
Fig. 11.2b: Graph view toolbar
The following buttons are displayed on the toolbars.
View graph on actual data window
Pressing this button a new window, containing the graph of the active data table, is displayed.
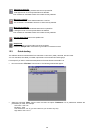
Preference dialog
On preferences menu command you can set :
Instrument
- Tag name ( max 7 characters ).
- Emissivity ( from 0.10 to 1.00 ).
- Temperature scale ( IPTS 68 or ITS90 )
- Units ( °C, °F or K ).
- Decimal point ( 1 or 0.1 ).
- Alarms value and check box ( on/off ).
- Sampling time and total time of PC log.
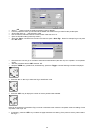
Header
Lines ( max 10 ).
Footer
Lines ( max 10 ).
Print
- Top, header, left, right, bottom and footer distance in inches.
- Enable/Disable Grid and color.
- Enable/Disable Center table horizontally
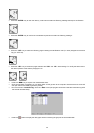
Graph
- Autoscale or Lower and Upper Limits.
Select decimal point
(0 or 1)
Select engineering units
( °C, °F or K ).
Enable/Disable alarms
Copy into a new file
Use this command to copy selected data onto a new file.
This command is unavailable if there are no data currently selected.