


C - Command Summary
88
MEASure:ARRay:VOLTage:FLUCtuations:ALL?
This query measures voltage fluctuations in accordance with the IEC 868 standard. It is only available
when IEC mode is selected with SYSTem:CONFigure. The parameter specifies the number of Pst
integration periods during which data will be returned in response to the query.
This query returns the data structures associated with both the MEAS:ARR:VOLT:FLUC:FLIC query
and the MEAS:ARR:VOLT:FLUC:PST query. The Pst structure includes flicker perceptibility values
for the component percentiles making up Pst, the Pst value itself, various RMS voltage values (Dmax,
Dc, and Dt), together with indices for these RMS values that give their approximate location in the RMS
time series for the corresponding integration period.
An additional structure consisting of a 1024 point array of bins whose indices correspond to a set of
logarithmically weighted ranges of instantaneous flicker is returned for each Pst integration period. The
array covers a flicker perceptibility range of 0.01 to 10000 and the individual bins contain counts equal to
the accumulated number of occurrences of flicker within the bin range during the Pst integration period.
RMS voltage and instantaneous flicker values are returned once a second, while Pst data and the 1024
point arrays are returned once per Pst integration period. The data is always returned in order (i.e. the Pst
summary data immediately follows the last array of RMS voltage and flicker values for a given
integration period).
The total quantity of data returned by this query is demonstrated by the following example (assuming
50Hz operation): If CALCulate:INTegral:TIME specifies 10 minutes and <n> is set to 12, a 2 hour
measurement is initiated (10 minutes times 12) and a total of 1,466,856 data points are returned (202
times 60 times 10 plus the 14 item Pst summary record plus 1024 log points all times 12 Pst integration
periods).
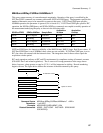
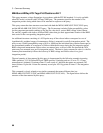
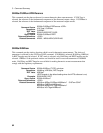
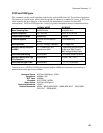
This command is closely related to two similar commands that return different data (see
MEAS:ARR:VOLT:FLUC:FLIC and MEAS:ARR:VOLT:FLUC:ALL). The figure below defines the
structure of the data returned by this query: