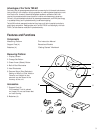
Tanita’s patented “foot-pad” design sends a safe,
low-level electrical signal through the body to
determine its composition.
TBF-621 Body Fat Monitor/Scale
Principles of Estimating Body Fat Percentage
The Tanita Body Fat Monitor/Scale TBF-621 allows you to estimate your body fat percentage
at home as easily as you measure your weight.
What is Body Fat Percentage?
Body fat percentage is the percentage of fat in your body. Until now, your absolute weight
has determined whether or not you were considered overweight or obese. In recent years,
the definition of obesity has been refined to mean the presence of excess body fat. Too much
body fat has been linked to conditions such as high blood pressure, heart disease, diabetes,
cancer, and other disabling conditions.
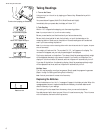
The chart below shows reasonable ranges of body fat percentage.
The BIA Method
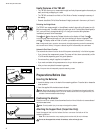
The TBF-621 uses the BIA (Bioelectrical Impedance Analysis) technique. In this method,
a safe low-level electrical signal is passed through the body. It is difficult for the signal to
flow through fat in the human body, but easy to flow through moisture in the muscle and
other body tissues. The difficulty with which a signal flows through a substance is called
impedance. So the amount of fat in the body can be accurately estimated by measuring
the impedance. The signal used is very low, making it safe and imperceptible.
The illustration on the left show how the signal travels through the body.
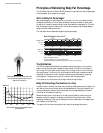
Body Fat Percentage Fluctuations in a Day
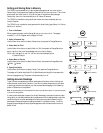
Hydration levels in the body may affect body fat readings. Readings are usually highest in the
early waking hours, since the body tends to be dehydrated after a long night’s sleep.For the
most accurate reading, a person should take a body fat percentage reading at a consistent
time of day under consistent conditions.
Besides this basic cycle of fluctuations in the daily body fat readings, variations may be
caused by hydration changes in the body due to eating, drinking, menstruation, illness,
exercising, and bathing. Daily body fat readings are unique to each person, and depend upon
one’s lifestyle, job and activities.
The graph on the left shows an example of daily body fat percentage fluctuations.
6 am
22
21
20
19
18
17
10 am 2 pm 6 pm 10 pm Time
Body Fat %
Daily fluctuations in body fat percentage based on
the BIA technique.
2
20–39
40–59
60–79
Healthy Overfat ObeseUnderfat
Healthy Overfat ObeseUnderfat
Based on NIH/WHO BMI Guidelines.
As reported by Gallagher, et al., at NY Obesity Research Center.
To determine the percentage of body fat that is appropriate for your body, consult your physician.
10%0% 20% 30% 40%
20–39
40–59
60–79
Female
Body Fat Ranges for Standard Adults
Age
Male
Age
1, 2
1
2


