


Understanding the Graph Function
The Graph is best read and interpreted after a significant number of
readings have been taken, with each of those readings being taken
under consistent conditions and at regular intervals. We recommend
that you take your body fat readings 30 or more times (for example,
once every week over an eight month period) before studying the
Graph (and/or this section of the manual).
The BF-572 tracks readings per use, rather than by date, and has the
capacity to store up to 84 readings per preprogrammed Personal Key.
If readings are taken weekly, the Graph would display any changes
of an individual’s body fat percentage during a 20-month period.
Note: Graph does not display specific body fat readings. It displays the
general trend over time.
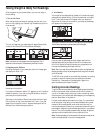
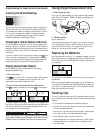
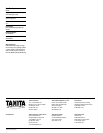
Graph Explanation
Column A Yellow Section/Current Reading
The bar displayed in this section represents your current body fat
percentage reading.
Columns B – E Light Blue Section
Column B: For this column, the unit calculates the average of the
most recent readings (up to seven) and displays that average as a bar.
The average is updated each time you take a body fat reading.
Column C: After every seventh reading, the average percentage that
previously appeared in Column B shifts left to Column C.
Columns D and E: As with Column C, these columns contain the
average from each previous column after that column reached its
seventh reading.
Note: Depending on whether this average is higher, the same, or lower
than the average of the previous column, the bar moves up to another
level, stays at the same level, or moves down to another level. Over time,
these bars create a line diagram.
Columns F and G Dark Blue Section
Each of the two bars in this section represents the average of the
preceding 28 readings. The two bars represent a total of 56, and
when added to the 28 readings in the Recent Results section, the
total number of readings stored is 84.
After 84 Readings: The oldest set of 28 readings are deleted every
time an additional set of 28 readings are stored.
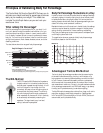
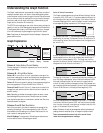
Value of Vertical Increments
The Graph creates diagrams using three different Values of Vertical
Increments, 0.2%, 0.5% and 1%, to accommodate the different lev-
els of change within each individual’s body. If the Value of Vertical
Increments displayed is 0.2%, each of the eight vertical increments in
the corresponding Graph represents a 0.2% change in body fat.
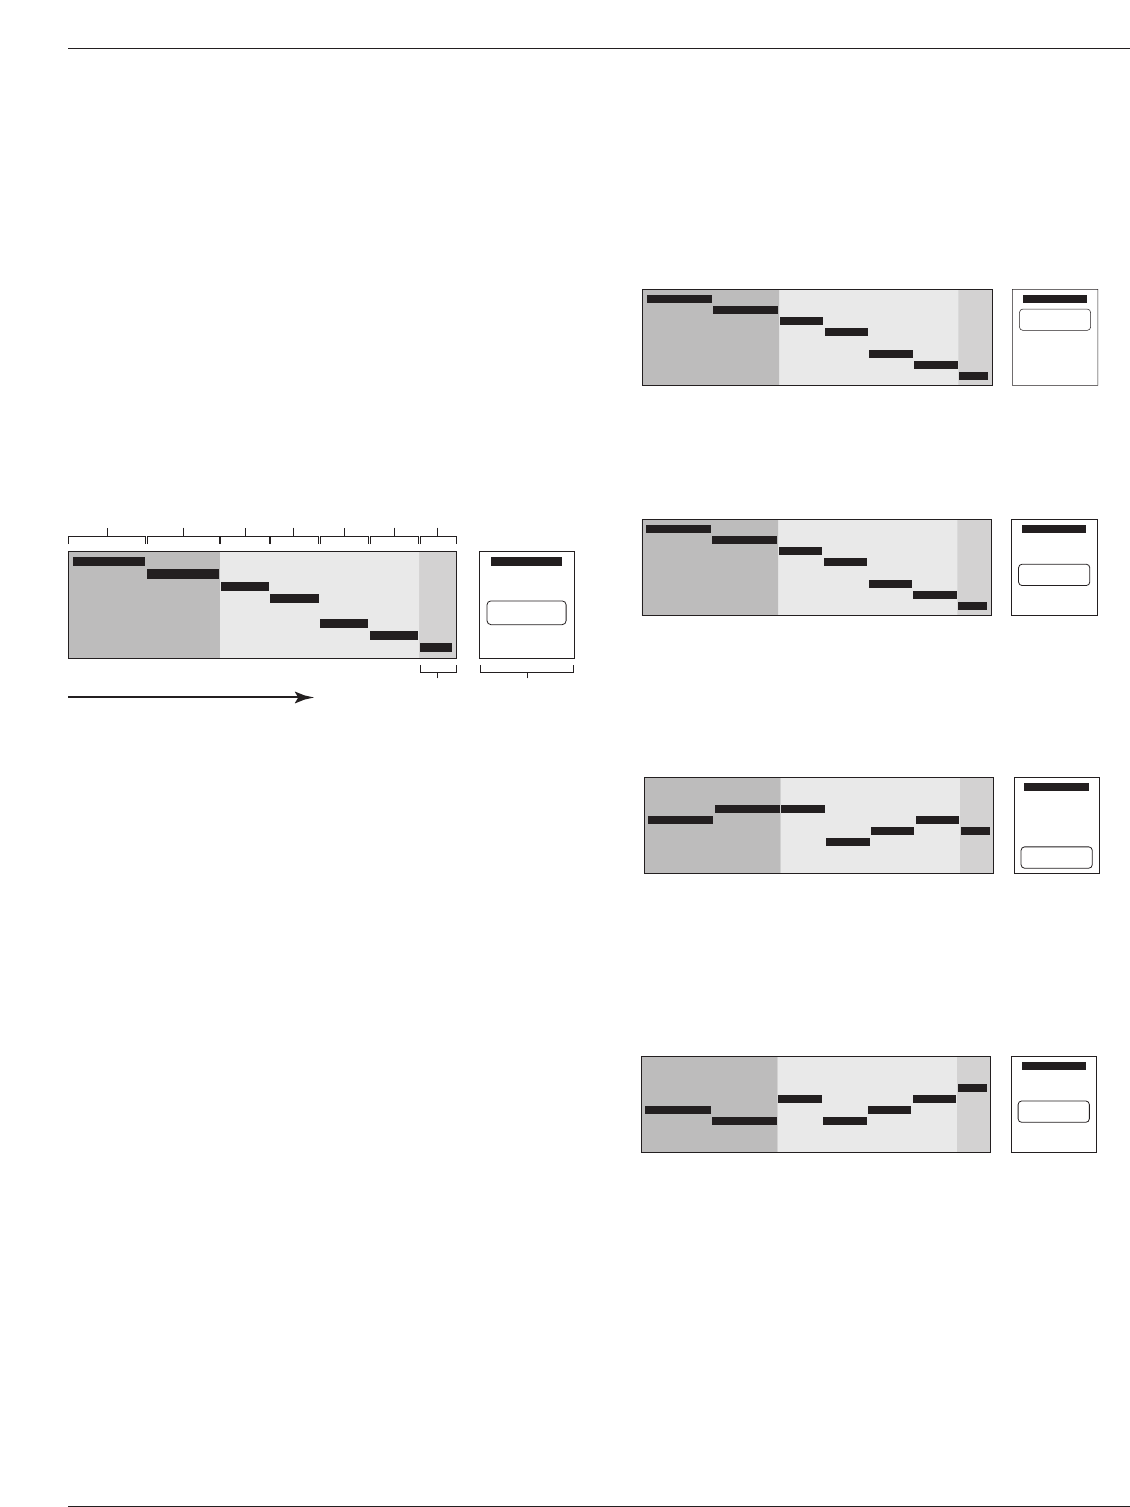
For example, Individual “1” has decreased his body fat percentage
significantly (in this case, 7%) between Column G and Column A,
so the resulting Value of Vertical Increments is at the highest num-
ber, which is 1%.
Another example shows Individual “2,” whose body fat percentage
has decreased over time, but not at the same rate as Individual “1”
as her body fat has decreased by 3.5%. The Graph may look the
same but the Value of Vertical Increments is 0.5%, showing a rate of
change which is half of that for Individual “1.”
The body fat of Individual “3” has remained relatively consistent over
time. His Graph is displayed at Value of Vertical Increments of 0.2%.
Although the Graph may at first look erratic, the overall trend is
uniform. His body fat has not changed more than 0.6% between one
set of readings and the next (between Columns D and E); and between
Column G and Column A, his body fat has changed only 0.2%.
Our final example shows the readings of Individual “4.” Her Graph
is at Value of Vertical Increment 0.5%. Her body fat has fluctuated
over time, but the overall trend shows an increase in body fat, with
a gain of 1% between Columns G and A.
Note: Fluctuations in body fat percentage may reflect inconsistency of
readings, women’s menstrual cycles, or changes in hydration levels.
Tanita recommends that users look at the overall trend,
rather than changes between readings.
7
Instruction Manual (English)
1.0%
0.5%
Current
Reading
Most Recent
Readings
Value of Vertical
Increments
ABCDEFColumn G
0.5%
0.2%
0.5%
1.
2.
3.
4.