


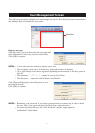
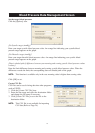
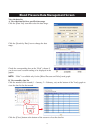
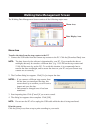
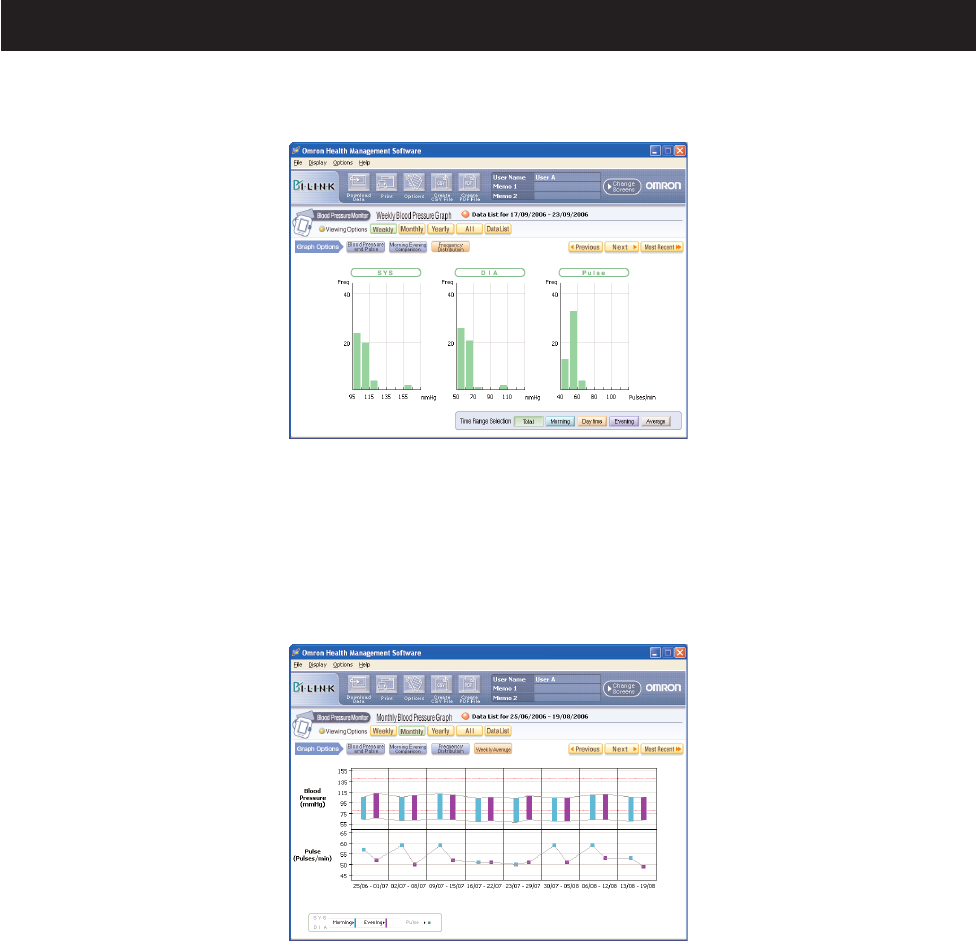
[Frequency Distribution]: Displays the frequency distribution of the blood pressure and pulse
readings.
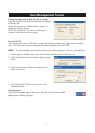
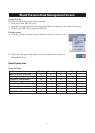
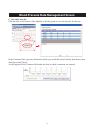
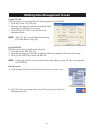
[Weekly Average]: Displays the weekly average value of the blood pressure and pulse readings.
When you use the M10-IT, M9 Premium or i-Q142 monitor, the first 3
measurements in the morning and last 3 measurements in the evening are
averaged. When you use the MIT Elite Plus, R7, 637IT or RX Genius monitor,
all measurements in the time range are averaged.
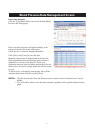
NOTES: • If the data are imported as a CSV file, all measurements in the time
range are averaged regardless of the monitor you use.
• If one user uses 2 or more monitors, do not refer to the Weekly
Average graph.
14
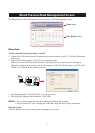
Blood Pressure Data Management Screen