23
SIMPLE TUNING PROCEDURE
The following procedure uses a graphical technique of ana-
lyzing a process response curve to a step input.
1. Starting from a solution with an EC or TDS value quite
different from the dosed liquid, turn on the dosing device
at its maximum capacity without the controller in the loop
(open loop process). Note the starting time.
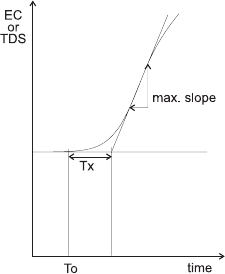
2. After some delay (T
0
) the EC or TDS starts to vary. After
more delay, the EC or TDS will reach a maximum rate of
change (slope). Note the time that this maximum slope
occurs and the EC or TDS value at which it occurs. Note
the maximum slope in EC or TDS per minute. Turn the
system power off.
3. On the chart draw a tangent to the maximum slope point until
intersection with the horizontal line corresponding to the initial
EC or TDS value. Read the system time delay Tx on the time axis.
4. The deviation, Ti and Td can be calculated from the following:
• Deviation = Tx * max. slope (EC/TDS)
• Ti = Tx / 0.4 (minutes)
• Td = Tx * 0.4 (minutes).
5. Set the above parameters and restart the system with the
controller in the loop. If the response has too much over-
shoot or is oscillating, then the system can be fine-tuned
slightly increasing or decreasing the PID parameters one
at a time.
Note Connecting an external device (e.g. chart recorder) to the
controller, the procedure is easier and doesn’t need the use
of hand plotting the process variable (EC or TDS).


